
Free ECG Course — Kraemer Academy
> Spent money and still haven't learned ECG? Does every ECG course feel the same to you? Have you given up? Tired of unfulfilled promises on this topic?
Well, you've never seen a course like this one from the Kraemer Academy with Professor Dr. Alessandro Kraemer, Cardiologist and Electrophysiologist specializing in ECG for 30 years teaching his students in Curitiba, Brazil. This course is now available to you for free!
It is part of a larger course delivered at Universidade Positivo, using the exact same slides presented to in-person students. Enjoy! It's free. But watch it from the beginning.
Are we really starting with the "worst" topic — the electrical axis? Yes, and it's actually the BEST way to start learning in Kraemer Academy's "disruptive mode." You'll be surprised. Just watch it to the end. To the very end, OK?
Afterwards, don't forget to leave your LIKE and a comment. We'd love to know you enjoyed it! The video below gives access to the full playlist:
▶ Watch the video — Full Playlist
---
About this Document
Free ECG Course for Electrocardiogram Interpretation (Updated 2026) — A complete and definitive guide for students, beginners, and "Nubs," totally free and top-quality!
This document consolidates the fundamental ECG lessons, organizing them in a structured, didactic, and progressive way, with a focus on practical clinical interpretation — the same content presented to 6th-year Medical students at Universidade Positivo in Curitiba, Brazil.
You can watch everything described in this document on the TEMECG! by Kraemer Academy YouTube channels.
---
1. ECG Fundamentals
The ECG machine measures voltage from the heart's electrical activity.
| Phenomenon | Definition | Mechanical result |
|---|---|---|
| Depolarization | Electrical activation of cardiac cells | Systole |
| Repolarization | Return to the baseline electrical state | Diastole |
Our free ECG course starts with the electrical axis on purpose — it's exactly where students get lost from the very beginning of medical school. Don't worry: you will learn this topic now in a disruptive way that will impress you from the very first video.
> 💡 Tip: By watching the electrical axis series, you'll be able to interpret an ECG like a cardiologist by the seventh video — in just a few seconds of analysis!
---
2. ECG Waves and Complexes
P Wave
Atrial depolarization. Although it appears as a single wave, it actually contains two P waves: one for the right atrium and one for the left atrium.
QRS Complex
Ventricular depolarization. Used as a synonym for "ventricle." The term "QRS" is used regardless of whether all three typical waves are present — a "QRS" can be only an "R," in which case we say the "QRS has an R pattern."
Ventricular T Wave
Ventricular repolarization. Represents ventricular diastole.
Atrial T Wave
Atrial repolarization. Not visible on the standard ECG because it occurs simultaneously with the QRS complex. It is a wave opposite to the P wave and adjacent to it — it becomes visible only in complete AV blocks, when the QRS separates from the P wave.
---
Why is the T wave not the mirror image of the QRS?
In the ventricles, depolarization travels through the His-Purkinje system, while repolarization uses the ventricular syncytium (which is slower). Repolarization travels "in reverse" from epicardium to endocardium — producing a vector identical to depolarization — causing the T wave to have the same polarity as the dominant QRS, but broader.
This has a fundamental consequence for ischemia analysis:
1. The non-ischemic T wave and its narrow QRS will always be concordant in polarity.
2. The non-ischemic T wave and its wide QRS will always be discordant in polarity.
3. Exception: V1, V2, and V3 may follow any pattern — always interpret in the clinical context.
> More on this in the Coronary Syndrome section.
---
3. QRS Complex Morphologies
The QRS complex can assume different morphologies:
| Morphology | Notes |
|---|---|
| qRs | Small q, dominant R, small s |
| Rs | Dominant R with small s |
| R | R wave only |
| qR | Small q with dominant R |
| Qr | Pathological Q with small r |
| QS | No R wave — semiological value of a pathological Q wave |
| Rsr' | "Rabbit ear" pattern — characteristic of RBBB in V1 |
| Rsr's' | "Fragmented" QRS — small foci of necrosis or electrical tissue loss (storage diseases, Chagas disease, etc.) |
QRS Width
- Narrow QRS: < 3 small squares — normal pattern.
- Wide QRS: > 3 small squares — defines Bundle Branch Block (if sinus/supraventricular rhythm) or ventricular arrhythmia (usually Ventricular Tachycardia).
q and Q Waves
| Wave | Characteristics | Meaning |
|---|---|---|
| q (lowercase) | < 1 mm in width and/or height | Always physiological (narrow QRS) |
| Q (uppercase) | > 1 mm in width and/or height | Always pathological (narrow QRS) |
> When a Q wave is pathological but still smaller than R, the QRS is classified as qR with pathological Q.
---
4. Intervals and Segments
PR Interval
Normal values: 3 to 5 small squares.
| Value | Meaning |
|---|---|
| < 3 small squares | Pre-excitation syndromes (e.g., Wolff-Parkinson-White) |
| 3 to 5 small squares | Normal |
| > 5 small squares | Atrioventricular blocks (1st, 2nd, or 3rd degree) |
PR Segment
The segment between the end of the P wave and the beginning of the QRS (a flat line). It marks the ECG baseline used to determine whether the ST segment is elevated or depressed.
QT Interval
Encompasses both ventricular depolarization and repolarization — represents the complete cardiac cycle. It is the most difficult interval to measure on the ECG.
Mandatory measurement in:
- Patients with syncope
- Poly-medicated patients (risk of sudden death from Torsades de Pointes)
> 💡 Use the qtc.mocha.app application to safely and quickly measure QTc by photographing your ECG.
▶ How to use the QTc app (narrow QRS)
!QT Nomogram using Bazett's formula in millimeters
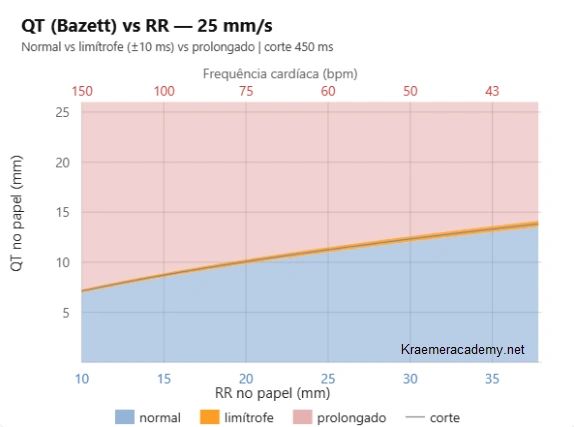
Kraemer Academy simplified QTc calculation by eliminating formulas from the workflow. Just count the small squares for the QT and RR intervals and plot them on the nomogram above — or use the app:
▶ How to use the QTc app (narrow QRS — second tutorial)
#### QTc with Wide QRS (Bundle Branch Block)
When the QRS is wide, the QTc must first be corrected using the Bogossian formula before applying heart rate correction formulas. The qtc.mocha.app automates this entire process: measure the QT as usual and request the Bogossian correction at the end.
▶ QTc with wide QRS — full tutorial
---
5. Atrioventricular Blocks (AVB)
Types of AVB
1st-degree AVB
PR persistently prolonged (> 5 small squares). All P waves conduct.
2nd-degree AVB — Mobitz I (Wenckebach)
Progressive PR prolongation until a P wave fails to conduct. The next P wave restarts the cycle with the shortest PR in the sequence. This decremental behavior is typical of the AV node — a less severe conduction defect. Can be caused by negative chronotropic drugs; withdrawing the medication usually resolves it.
2nd-degree AVB — Mobitz II
P wave is blocked without progressive PR prolongation. This "all-or-nothing" behavior is characteristic of the His bundle — a more severe defect. Negative chronotropic drugs do not affect the His bundle.
2nd-degree AVB — 2:1
Two P waves for each QRS. Cannot distinguish Mobitz I from Mobitz II without two preceding PR intervals before the blocked P wave.
2nd-degree AVB — 3:1 or higher
Three or more P waves per QRS — called advanced atrioventricular block (not to be confused with complete heart block).
3rd-degree AVB (Complete Heart Block)
AV dissociation with a possible escape rhythm. With escape beats present, differentiate from other degrees by searching for false short PR intervals (PR < 3 small squares in a tracing with ventricular bradycardia).
> ⚠️ In AV blocks, the P wave always has an equal or higher heart rate than the QRS. If the P rate is lower than the QRS rate, the problem lies in the sinus node's ability to command the ventricles (sick sinus syndrome or sinus arrest).
Pacemaker Indication — General Guidance
| Degree of AVB | Pacemaker indication |
|---|---|
| 1st-degree AVB | ❌ No |
| 2nd-degree Mobitz I | ❌ No |
| 2nd-degree Mobitz II | ✅ Yes |
| Advanced AVB | ✅ Yes |
| 3rd-degree AVB | ✅ Yes |
> ⚠️ Warning: This table is a general mnemonic that may lead to incorrect decisions. Always consult the guidelines (AHA, SOBRAC, SBC). Do not rely on mnemonics as a sole reference.
▶ Video summary — ECG from Zero (TEMECG! channel)
---
7. Calculating Heart Rate on the ECG
One of the most practical ways to calculate heart rate (HR) on the ECG is through rule-of-three methods using preset time references.
7.1 Using the Full ECG Strip (10 seconds)
A standard ECG strip = 10 seconds = 50 large squares of 200 ms each.
Method: count the QRS complexes on the strip and multiply by 6.
> Example: 10 QRS complexes in 10 seconds → 10 × 6 = 60 bpm
This method is especially useful for irregular rhythms.
▶ Heart rate calculation — explanatory video
7.2 Using the Interval Between Two Beats
With just two consecutive beats, apply one of the formulas below:
```
1500 ÷ (number of small squares between beats) = HR in bpm
300 ÷ (number of large squares between beats) = HR in bpm
60,000 ÷ (milliseconds between beats) = HR in bpm
```
Mnemonic sequence for large square intervals:
> 300 → 150 → 100 → 75 → 60 → 50 → 40 bpm
▶ Full heart rate series on the ECG
---
8. Heart Rate Calculation in Very Slow Rhythms
In extremely slow rhythms, it is more appropriate to express pauses in seconds rather than bpm.
8.1 Measuring the Pause
> Example: interval between QRS complexes spanning 18 large squares → 18 × 200 ms = 3,600 ms = 3.6 seconds
>
> Report as: "pauses of up to 3.6 seconds"
This approach is particularly relevant in advanced blocks, escape rhythms, and pacemaker implantation assessment.
▶ Slow rhythms — explanatory video
---
9. Conceptual Integration: Applied Electrical Fundamentals
The ECG records cardiac electrical activity captured at the body surface — it measures differences in electrical potential generated by myocardial depolarization and repolarization, allowing graphical representation of the resulting vectors.
▶ How the ECG works — why Einthoven won the Nobel Prize
9.1 Depolarization and QRS Complex Formation
Ventricular depolarization occurs in an organized fashion through the His-Purkinje system. The vector sequence determines QRS morphology in each lead.
- Narrow QRS (< 3 small squares) → preserved intraventricular conduction.
- Wide QRS → bundle branch block or ventricular origin (non-supraventricular rhythm).
▶ QRS formation — ECG from Zero video
9.2 Ventricular Repolarization and the T Wave
Ventricular repolarization generates a T wave that is typically concordant with the QRS — because the spatial sequence of repolarization is opposite to depolarization, producing a similar final electrical vector.
Fundamental practical rules:
| Situation | T / QRS relationship | Interpretation |
|---|---|---|
| Narrow QRS + concordant T | ✅ Normal | Expected repolarization |
| Narrow QRS + discordant T | ⚠️ Suspect ischemia | Evaluate context |
| Wide QRS + discordant T | ✅ Normal | Appropriate discordance |
| Wide QRS + concordant T | ⚠️ Suspect ischemia | Evaluate context |
> ⚠️ Attention to V1, V2, and V3: the rule above has exceptions in these leads — always interpret in the clinical context.
Extension of the T wave rule to the ST segment (valid for LBBB):
| ST vs. wide QRS (LBBB) | Interpretation |
|---|---|
| Discordant with wide QRS (LBBB) | Normal (expected discordance) |
| Concordant with wide QRS (LBBB) | Suspect Acute Coronary Occlusion |
> ⚠️ In RBBB, ST elevation is always equivalent to an acute coronary occlusion; ST depression does not necessarily represent an occlusion.
---
10. QRS Electrical Axis in 1 Second — Visual Cartesian Method
Calculating the electrical axis does not require precise determination in degrees. In clinical practice, simply identify the dominant vector quadrant.
!The axis is a boy. The lead is a girl. Girls register positivity when boys approach
10.1 Cartesian System Applied to the ECG
The positive pole of each lead ("girl") is always positive. The vector ("boy") either approaches or moves away from it. Einthoven strategically positioned the electrodes so that the normal vector (directed downward and to the left) would register as positive.
| Lead | Axis represented | Electrode position |
|---|---|---|
| I (D1) | X axis | Left arm (left positive, right negative) |
| aVF | Y axis | Foot (inferior positive, superior negative) |
| V1 | Anteroposterior dimension | Anterior positive, posterior negative |
10.2 Rapid Quadrant Determination
| Lead I | aVF | Quadrant | Axis |
|---|---|---|---|
| ➕ | ➕ | Inferior-left | Normal |
| ➕ | ➖ | Superior-left | Left axis deviation |
| ➖ | ➕ | Inferior-right | Right axis deviation |
| ➖ | ➖ | Superior-right | Extreme / indeterminate axis |
> The normal axis is between +90° and −30° in the frontal plane.
▶ Electrical axis — video 3 of the TEMECG! series
---
11. The −30° Inconvenience and the Practical Solution
The lower boundary of the normal axis (−30°) can be confusing: a negative QRS in aVF does not always indicate pathological left axis deviation.
11.1 Strategy Using Lead II (D2)
Observe Lead II in addition to Lead I:
- Lead I and Lead II both positive (or isoelectric) → axis is necessarily between +90° and −30° → normal.
- Lead II negative → true left axis deviation.
- Lead I negative → consider right or extreme axis deviation.
- Lead III may occasionally be negative even with a normal axis.
> 💡 The combined observation of Lead I + Lead II + aVF resolves the axis calculation in approximately 1 second, with no angular computation needed.
▶ The −30° inconvenience — video 4 of the TEMECG! series
---
12. Rapid Diagnosis in the Emergency Department Using the Electrical Axis
Most abnormal sinus ECGs can be initially stratified using just two pieces of information: axis + QRS width.
12.1 Core Premises
1. The normal heart is rotated to the left and anteriorly.
2. Narrow QRS (< 120 ms) → suggests abnormality due to hypertrophy.
3. Wide QRS (> 120 ms) → suggests bundle branch block.
12.2 Diagnosis by Axis and Width
| QRS | Axis | Likely diagnosis |
|---|---|---|
| Narrow | Left / inferior / posterior + high amplitude | Left Ventricular Overload |
| Narrow | Right / anterior | Right Ventricular Overload |
| Wide | Left / posterior | Left Bundle Branch Block |
| Wide (terminal portion rightward/anterior) | Right / anterior | Right Bundle Branch Block |
12.3 Left Fascicular Blocks
| Block | Lead I | aVF |
|---|---|---|
| Left Anterior Fascicular Block | ➕ | ➖ |
| Left Posterior Fascicular Block | ➖ | ➕ |
> ⚠️ Other fascicular combinations must be interpreted in the clinical context.
12.4 Is the P Wave Always Sinus?
The P wave is not synonymous with sinus rhythm. For it to be sinus, the P wave's electrical axis must point downward, to the left, and posteriorly (small in V1). In V1, the normal P wave is biphasic (plus-minus):
- Positive component (forward, toward the right atrium): if > 1 mm → right atrial overload.
- Negative component (backward, toward the left atrium): if > 1 mm → left atrial overload (Morris index).
If the P wave axis does not point inferior-left-posterior → ectopic atrial rhythm (non-sinus). If above 100 bpm → ectopic atrial tachycardia.
▶ P wave and sinus rhythm — TEMECG! video
---
Conclusion: What Do I Do Now That I Can Interpret the Electrical Axis?
You have just learned to interpret ~80% of emergency department and office ECGs. In practice:
- Normal ECG → conclude the basic analysis.
- Abnormal ECG → probable cardiomyopathy → refer to a cardiologist.
- Syncope + bundle branch block → possible intermittent complete heart block → call a cardiologist; consider electrophysiology study to measure the HV interval.
- Syncope + AVB present → possible more advanced intermittent AVB → order Holter monitoring and refer to cardiology.
- Chest pain + bundle branch block → apply the T wave and ST concordance rules (LBBB/RBBB) to identify acute myocardial infarction with coronary occlusion.
---
17. Coronary Syndrome on the ECG
Interpreting coronary syndrome requires an integrated understanding of the relationship between QRS complex, ST segment, and T wave, taking QRS width and clinical context into account.
17.1 T Wave Rule — General Summary
| QRS | T wave vs. QRS | Interpretation |
|---|---|---|
| Narrow | Concordant | ✅ Normal |
| Narrow | Discordant | ⚠️ Suspect ischemia |
| Wide (LBBB) | Discordant | ✅ Normal (appropriate discordance) |
| Wide (LBBB) | Concordant | ⚠️ Suspect ischemia |
| Wide (RBBB) | Discordant (terminal portion) | ✅ Normal |
| Wide (RBBB) | Concordant (terminal portion) | ⚠️ Suspect ischemia |
> ⚠️ Exception: V1, V2, and V3 may show physiological variations — always interpret in the clinical context.
In LBBB, the T wave rule also applies to the ST segment: discordant ST elevation or depression is expected; concordance suggests Acute Coronary Occlusion (ACO).
17.2 International Definition of STEMI
ST elevation ≥ 1 mm in at least two contiguous leads of the same wall (always with narrow QRS).
Exception in V2–V3:
| Group | Criterion |
|---|---|
| Women | ≥ 1.5 mm |
| Men > 40 years | ≥ 2.0 mm |
| Men < 40 years | ≥ 2.5 mm |
> The presence of ST depression in other leads reinforces that the ST elevation is a true positive for ACO.
17.3 ACO and SACO — New Concept
Acute myocardial infarction is now understood as a spectrum of coronary occlusion:
- ACO — Acute Coronary Occlusion (100%)
- SACO — Subacute Coronary Occlusion (~99%)
Patterns such as Wellens and De Winter frequently represent severe sub-occlusion states.
> 💡 The hyperacute T wave ("shark fin") is the earliest pattern of ACO — it precedes ST elevation and is very difficult to diagnose. Artificial intelligence applications outperform human diagnosis for this pattern. Kraemer Academy is developing an AI app trained to detect hyperacute T waves — stay tuned for its launch.
17.4 Classic High-Risk Patterns
- "Happy" ST elevation → does not rule out ACO; repeat ECG in 10 minutes if in doubt.
- Wellens (type A and B) → critical LAD sub-occlusion (severe SACO from spontaneous recanalization of an ACO).
- Pardee pattern → typical transmural ST elevation.
- De Winter → equivalent of very severe SACO (possible left main coronary or equivalent — frequently associated with ST elevation in aVR).
- Hyperacute T wave → initial phase of STEMI — difficult to diagnose for humans.
- Disproportionate ST elevation in hypertrophy.
17.5 AMI versus Pericarditis
Features favoring AMI with ST elevation:
- ST depression (except in V1 or aVR)
- ST elevation in Lead III greater than in Lead II
- Horizontal or convex ST elevation
- Absence of PR depression
- Absence of Spodick's sign
> 🧠 Kraemer Academy mnemonic: "Pericarditis is afraid of the rabbit accelerating in V1 and listening to its neighbor aVR — pericarditis is always happy but hates the rabbit revving its engine."
---
18. Tachyarrhythmias on the ECG
Tachyarrhythmias are rhythms with HR above 100 bpm (RR interval < 600 ms). They require systematic analysis of:
- QRS width
- RR interval regularity
- Relationship between P waves and QRS complexes
18.1 Initial Classification by QRS
| QRS | Likely origin |
|---|---|
| Narrow | Supraventricular (uses His-Purkinje system) |
| Wide monomorphic | Ventricular or supraventricular with aberrancy |
| Wide polymorphic | Always ventricular (polymorphic VT, VF, or Torsades) |
Differentiating polymorphic wide QRS by context:
- Prolonged QT → Torsades de Pointes
- ST elevation present → Ventricular Fibrillation
- Structurally normal heart → Catecholaminergic VT
> 💡 Two-Rhythm Concept: always consider an atrial rhythm (P waves) and a ventricular rhythm (QRS). AV dissociation strongly suggests Ventricular Tachycardia.
18.2 Atrial Fibrillation and Flutter — The "Magic Number" 200 ms
On ECGs with irregular RR, use the FF interval (between flutter/fibrillation waves):
| FF Interval | Diagnosis |
|---|---|
| < 200 ms | Atrial Fibrillation |
| 200–250 ms | Atrial Flutter |
| > 250 ms | Atrial Tachycardia |
Atrial fibrillation is characterized by chaotic f waves and an irregularly irregular RR interval.
18.3 Atrial Premature Beats and Atrial Fibrillation
Very early atrial premature beats can trigger atrial fibrillation. They may be conducted with a narrow or wide QRS (aberrancy) and, when non-conducted, can mimic 2:1 AV block.
18.4 PSVT — Paroxysmal Supraventricular Tachycardia
Mainly includes:
- AVNRT — AV Nodal Reentrant Tachycardia
- Accessory pathway tachycardia (concealed or manifest — WPW)
- Focal atrial tachycardias
| RP' interval | Most likely diagnosis |
|---|---|
| RP' < 70 ms | AVNRT |
| RP' > 70 ms | Accessory pathway |
> Most PSVTs revert with adenosine. Treatment failure suggests an alternative diagnosis.
18.5 Wolff-Parkinson-White Syndrome (WPW)
Characterized by a delta wave and a short PR interval. During orthodromic tachycardia, the delta wave may disappear. Catheter ablation is the curative treatment.
18.6 Ventricular Tachycardias
- Wide monomorphic QRS with AV dissociation → VT.
- Fusion beats or sinus capture beats confirm ventricular origin.
- Structural heart disease significantly increases the probability of VT.
After polymorphic VT or VF, evaluate QTc in sinus rhythm to investigate long QT syndrome.
> ⚠️ Important: We no longer recommend using Brugada criteria (or derivatives) for the definitive diagnosis of wide QRS tachycardias. Pre-test probability and clinical context are more relevant. Electrophysiology study is essential for both diagnosis and curative treatment.
For invasive diagnosis, Kraemer Academy and the Electrophysiology Laboratory of Curitiba created an exclusive application for use in the EP lab:
> lec.mocha.app — 100% diagnostic accuracy for inducible arrhythmias during invasive electrophysiology study. A complete literature review of the past 10 years (through 2026), developed by Alessandro Kraemer without the use of artificial intelligence.
Conclusion on Tachyarrhythmias
Interpreting tachyarrhythmias should prioritize:
1. QRS width
2. Rhythm regularity
3. Presence or absence of AV dissociation
Clinical reasoning outperforms complex algorithms — pre-test probability and clinical context are the determinants of a correct diagnosis.
---
About the Author
Alessandro Kraemer is a clinical cardiologist and invasive electrophysiologist. Professor of ECG at Universidade Positivo (6th year of Medical School, top score on ENAMED). He works at the LEC — Electrophysiology Laboratory of Curitiba.
He is the author of "The Art of Electrocardiography" (ISBN 9792471000061), a collection of 8 ECG books teaching all levels simultaneously.
🗓️ Schedule a medical appointment
---
REFERENCES
ECG IN 24H HOLTER MONITORING
KRAEMER, A. (2017). Identification of the site of origin of ventricular premature beats by 24-hour Holter monitoring.
---
ATYPICAL ACCESSORY PATHWAYS
Arq. Bras. Cardiol. 80 (1) • Jan 2003
---
LONG QT INTERVAL
1) Viskin S, Rosovski U, Sands AJ, et al. Inaccurate electrocardiographic interpretation of long QT: the majority of physicians cannot recognize a long QT when they see one. Heart Rhythm. 2005;2(6):569-74. DOI | PubMed
2) Rautaharju PM, Surawicz B, Gettes LS, et al. AHA/ACCF/HRS recommendations for the standardization and interpretation of the electrocardiogram: Part IV: The ST segment, T and U waves, and the QT interval. Circulation. 2009;119(10):e241–50. DOI | PubMed
3) Funck-Brentano C, Jaillon P. Rate-corrected QT interval: techniques and limitations. Am J Cardiol. 1993;72(6):17B-22B. DOI90035-3) | PubMed
4) Gow RM. How to measure the QT interval. Med J Aust. 2017;206(9):399-400. DOI | PubMed
5) Luo S, Michler K, Johnston P, Macfarlane PW. A comparison of commonly used QT correction formulae: the effect of heart rate on the QTc of normal ECGs. J Electrocardiol. 2004;37 Suppl:81-90. DOI | PubMed
6) Rautaharju PM, Zhang ZM. Linearly scaled, rate-invariant normal limits for QT interval: eight decades of incorrect application of power functions. J Cardiovasc Electrophysiol. 2002;13(12):1211-1218. DOI | PubMed
7) Bazett HC. An analysis of the time-relations of electrocardiograms. Heart. 1920;7:353-370. Google Scholar
8) Fridericia LS. Die Systolendauer im Elektrokardiogramm bei normalen Menschen und bei Herzkranken. Acta Med Scand. 1920;53:469-486. Google Scholar
9) Sagie A, Larson MG, Goldberg RJ, Bengtson JR, Levy D. An improved method for adjusting the QT interval for heart rate (the Framingham Heart Study). Am J Cardiol. 1992;70(7):797-801. DOI90562-D) | PubMed
10) Hodges M. Rate correction of the QT interval. J Electrocardiol. 1983;16(3):306. Google Scholar
11) Dmitrienko AA, Sides GD, Winters KJ, Kovacs SJ. Electrocardiographic assessment of QT interval prolongation in clinical trials: new correction methods. Pharm Stat. 2005;4(3):157-169. DOI
12) Brazilian Society of Cardiology. Guidelines of the Brazilian Society of Cardiology on analysis and issuance of electrocardiographic reports. Arq Bras Cardiol. 2009;93(3 Suppl 2):1-19. Google Scholar
---
THE NORMAL ECG
1. Paulo Jorge Moffa, Paulo César R Sanches. Tranquesi — Normal and Pathological Electrocardiogram. São Paulo: Roca, 2001. Google Scholar
2. Samesima N, God EG, Kruse JCL, et al. Brazilian Society of Cardiology Guidelines on the Analysis and Issuance of Electrocardiographic Reports – 2022. Arquivos Brasileiros de Cardiologia. 2022, Vol. 119(4), pp. 638-680. DOI | PubMed
3. Surawicz and Knilans. Chou's Electrocardiography in Clinical Practice. Philadelphia: Saunders, 2008. Google Scholar
4. Paul Kligfield, Leonard S. Gettes, James J. Bailey, et al. Part I: The Electrocardiogram and Its Technology. Circulation. 2007, Vol. 115, pp. 1306–24. DOI | PubMed
5. Jay W. Mason, E. William Hancock and Leonard S. Gettes et al. Recommendations for the Standardization and Interpretation of the Electrocardiogram: Part II. Circulation. March 2007, Vol. 115(1013). DOI | PubMed
6. A., Bayes de Luna. Textbook of Clinical Electrocardiography. John Wiley & Sons, Ltd — Wiley-Blackwell, 2012. Google Scholar
7. David H Spodick, Worcester Muss. Normal sinus heart rate: Sinus tachycardia and sinus bradycardia redefined. American Heart Journal. October 1992. DOI90001-N) | PubMed
8. Jay W. Mason, Thomas E. Moon, Daniel B. Goodman, Boaz Mendzelevski. Electrocardiographic reference ranges derived from 79,743 ambulatory subjects. Journal of Electrocardiology. 2007, Vol. 40, pp. 228–234. DOI | PubMed
9. A, Waart. de — Het Levenswerk van Willem Einthoven. Haarlem: Erven F. Bohn, 1957. Google Scholar
10. Einthoven, W. Un nouveau galvanometre. Arch Neerl Sc Ex Na. 1901. Google Scholar
11. Lindsay, Majd AlGhatrif and Joseph. A brief review: history to understand fundamentals of electrocardiography. Journal of Community Hospital Internal Medicine Perspectives. 2012. DOI | PubMed
12. E., Frank. An Accurate, clinically practical System for spatial vectorcardiography. Circulation. May 1956, Vol. 13(5):737-49. DOI | PubMed
13. Burger H.C., Van Milann J.B. Heart vector and leads. British Heart Journal. 1948, Vol. 10:229. Google Scholar
14. Morris J J, Estes E H Jr, et al. P wave analysis in valvular heart diseases. Circulation. 1964, Vol. 24, p. 242. DOI | Google Scholar
15. Munuswami K, Alpert M A, et al. Sensitivity and specificity of commonly used electrocardiographic criteria for left atrial enlargement. American Journal of Cardiology. 1984, Vol. 53, p. 829. PubMed
16. Saunders J L, et al. Evaluation of criteria for P wave abnormalities. American Heart Journal. 1967, Vol. 74, p. 757. PubMed
17. Hazen M S, Marvick T H, Underwood D A. Diagnostic accuracy of the resting electrocardiogram in detection and estimation of left atrial enlargement. American Heart Journal. 1991, Vol. 122, p. 823. DOI90527-N) | PubMed
18. Kaplan J D, Evans J R T, et al. Evaluation of electrocardiographic criteria for right atrial enlargement. Journal of American College of Cardiology. 1994, Vol. 23, p. 747. DOI90762-5) | PubMed
19. L Wolff, J Parkinson, D White. Bundle branch block with short PR interval in healthy young people prone to paroxysmal tachycardia. American Heart Journal. 1930, Vol. 5, p. 685. DOI90086-X)
20. Borys Surawicz, Rory Childers, Barbara J Deal, et al. AHA/ACCF/HRS recommendations: part III: intraventricular conduction disturbances. Circulation. 2009, Vol. 119(10), pp. e235-40. DOI | PubMed
21. Rautaharju PM, Surawicz B, Gettes LS. AHA/ACCF/HRS Recommendations Part IV: The ST Segment, T and U Waves, and the QT Interval. Circulation. 2009, Vol. 119, pp. e241-e250. DOI | PubMed
22. HC., Bazett. An analysis of the time-relations of electrocardiograms. Heart. 1920, Vol. 7, pp. 35-72. Google Scholar
23. JOHN CHILADAKIS et al. Preferred QT Correction Formula for the Assessment of Drug-Induced QT Interval Prolongation. Journal of Cardiovascular Electrophysiology. August 2010, Vol. 21, pp. 905-913. DOI | PubMed
24. Pentti M Rautaharju, Jay W Mason and Toshio Akiyama. New age- and sex-specific criteria for QT prolongation. Int J Cardiol. 2014, Vol. 174(3), pp. 535-40. DOI | PubMed
25. LS, Fridericia. Die systolendauer im elektrokardiogramm. Acta Med Scand. 1920, Vol. 53, pp. 469-86. Google Scholar
26. Sagie A, Larson MG, Goldberg RJ, et al. An improved method for adjusting the QT interval for heart rate (the Framingham Heart Study). American Journal of Cardiology. 1992, Vol. 79, p. 797. DOI90562-D) | PubMed
27. Hodges M, Salerno D, Erlien D. Bazett's QT correction reviewed. Journal of the American College of Cardiology. 1983, Vol. 12, p. 694. Google Scholar
28. Das, Gopal. QT Interval and Repolarization Time in Patients With Intraventricular Conduction Delay. Journal of Electrocardiology. January 1990, Vol. 23(1), pp. 49-52. DOI90147-B) | PubMed
29. Crow RS, Hannan PJ, Folsom AR. Prognostic significance of corrected QT and corrected JT interval. Circulation. 2003, Vol. 108, pp. 1985-9. DOI | PubMed
30. Pentti M. Rautaharju, Zhu-Ming Zhang, Ron Prineas, Gerardo Heiss. Assessment of Prolonged QT and JT Intervals in Ventricular Conduction Defects. American Journal of Cardiology. 2004, Vol. 93, pp. 1017-1021. DOI | PubMed
31. Bogossian H, Linz D, Heijman J, et al. QTc evaluation in patients with bundle branch block. Int J Cardiol Heart Vasc. 2020, Vol. 30, pp. 1-5. DOI | PubMed
32. Lombard WP, Cope OM. Effect of pulse rate on the length of systoles and diastoles in the normal human heart. American Journal of Physiology. 1919, pp. 139-140. Google Scholar
33. Taran LM, Szilagyi N. The duration of the electrical systole, Q-T, in acute rheumatic carditis in children. Am Heart J. 1947, Vol. 33(1), pp. 14-26. DOI90165-0) | PubMed
34. Drouin E, Charpentier F, Gauthier C, Laurent K, LeMarec H. Electrophysiologic characteristics of cells spanning the left ventricular wall of human heart: evidence for presence of M cells. J Am Coll Cardiol. 1995, Vol. 26 p.185-92. DOI00167-X) | PubMed
35. Einthoven, W. The galvanometric registration of the human electrocardiogram. Cardiac Classics. 1941. Google Scholar
36. Einthoven, W. Le Télécardiogramme. Arch Internat Physiol. 1906, Vol. 4 p.132-64. Google Scholar
37. L.V., Décourt. Lessons in Cardiocirculatory Pathology. São Paulo: Melhoramentos, 1945. Google Scholar
38. Pastore CA, Moffa PJ. Technical aspects and clinical applications of electrocardiographic surface mapping. Arquivos Brasileiros de Cardiologia. 1992, Vol. 58(5):391-7. Google Scholar
39. Pérez-Riera AR, de Abreu LC, Barbosa-Barros R, et al. R-Peak Time: An Electrocardiographic Parameter with Multiple Clinical Applications. Ann Noninvasive Electrocardiol. 2016, Vol. 21(1):10-9. DOI | PubMed
40. DIRK DURRER et al. Total Excitation of the Isolated Human Heart. Circulation 1970, Vol. 44, pp. 899-912. DOI | PubMed
41. BURCH, GEORGE E. THE HISTORY OF VECTORCARDIOGRAPHY. Medical History. 1985, Vol. 5, pp. 103-31. Google Scholar
42. C, Chou T. Value and limitations of vectorcardiography in cardiac diagnosis. Cardiovasc Clin. 1975. Google Scholar
43. Chou T. When is the vectorcardiogram superior to the scalar electrocardiogram? J Am Coll Cardiol. 1986, Vol. 8, pp. 791-9. DOI80432-6) | PubMed
44. A, Helm R. Theory of vectorcardiography. Am Heart J. 1955, Vol. 49(1), pp. 135-59. DOI90088-9) | PubMed
45. Pahlm O, Haisty WKJ, Edenbrandt L et al. Evaluation of changes in standard electrocardiographic QRS waveforms. Am J Cardiol. 1992, Vol. 69(3), pp. 253-7. DOI91319-D) | PubMed
46. Uijen G J, Van Oosterom A, Van Dam R T H. The relationship between the 12-lead standard ECG and XYZ vector leads. Berlin: 14th International Congress Electrocardiology, 1988. Google Scholar
47. Kors JA, van Herpen G, Sittig AC, van Bemmel JH. Reconstruction of the Frank vectorcardiogram from standard electrocardiographic leads. Eur Heart J. 1990, Vol. 11(12), pp. 1083-92. DOI | PubMed
48. E, Frank. An accurate clinically practical system for spatial vectorcardiography. Circulation. 1954, Vol. 13(5), pp. 724-40. DOI | PubMed
49. Ricardo Luiz Ribeiro et al. Old and New Concepts on the U Wave of the Electrocardiogram. 2004. Google Scholar
50. Andrés Ricardo Pérez‐Riera, Luiz Carlos de Abreu, Raimundo Barbosa‐Barros. R‐Peak Time. Annals of Noninvasive Electrocardiology. Jan 2016, Vol. 21(1), pp. 10-9. DOI | PubMed
51. Surawicz and Knelans. Chou's Electrocardiography. Google Scholar
52. Lewis, Thomas. Clinical Electrocardiography. New York: Paul B. Hoeber, 1919. Google Scholar
53. BENJAMIN J. SCHERLAG et al. Catheter technique for recording His bundle activity in man. Circulation. 1969, Vol. 39, pp. 13-18. DOI | PubMed
54. Malhotra, A et al. Anterior T wave in young white Athletes and nonathletes. J. Am. Coll. Cardiol. Vol. 69(1), pp. 1-9. DOI | PubMed
55. Brosnam M, et al. The Seattle criteria increase the specificity of preparticipation ECG screening among elite athletes. British Journal of Sports Medicine. Vol. 48(15), pp. 1144-50. DOI | PubMed
56. Kristian Thygesen, Joseph S. Alpert, Allan S. Jaffe et al. Fourth universal definition of myocardial infarction 2018. European Heart Journal. 2019, Vol. 40, pp. 237-269. DOI | PubMed
57. AD, Waller. Circulation. An introduction to physiology. 1891, p. 52. Google Scholar
58. David H. Spodick, Mary Frisella and Sirin Apiyassawat. QRS Axis Validation in Clinical Electrocardiography. Am J Cardiol 2008;101:268–269. DOI | PubMed
---
CHAMBER OVERLOAD ON THE ECG
1. Hancock EW, Deal BJ, Mirvis DM et al. AHA/ACCF/HRS Recommendations Part V: Electrocardiogram Changes Associated With Cardiac Chamber Hypertrophy. Circulation. 2009;119:e251-e261. DOI | PubMed
2. Carter WA, Estes EH Jr. Electrocardiographic manifestations of ventricular hypertrophy. American Heart Journal. 1964, Vol. 68:173-82. DOI90066-3) | PubMed
3. Romhilt D, Estes E. A point Score system for the ECG diagnosis of left ventricular hypertrophy. American Heart Journal. 1968, Vol. 75:752-8. DOI90080-6) | PubMed
4. Romhilt DW, Bove KE, Norris RJ, et al. A critical appraisal of the electrocardiographic criteria for the diagnosis of left ventricular hypertrophy. Circulation. 1969, Vol. 40:185-95. DOI | PubMed
5. Barnes AR, Whitten MB. Study of T-wave negativity in predominant ventricular strain. American Heart Journal. 1929, Vol. 5, pp. 14-67. Google Scholar
6. Kaplan L G, Katz L N. The characteristic electrocardiograms in left ventricular strain. American Journal of Medicine. 1941, Vol. 201, pp. 676-93. Google Scholar
7. Van Dam RT, Durrer D. The T wave and ventricular repolarization. American Journal of Cardiology. 1964, Vol. 14:294. DOI90012-8)
8. Rodrigues MI, Anselmi A, Sodi-pallares D. Activacion de las paredes libres ventriculares I. Arch Inst Cardiol Mex. 1953, Vol. 23:624. Google Scholar
9. Rodrigues MI, Sodi-Pallares D, Anselmi A. Activacion de las paredes libres ventriculares II. Arch Inst Cardiol Mex. 1953, Vol. 23:756. Google Scholar
10. Paulo Jorge Moffa, Paulo Cesar Sanches. Tranquesi — Normal and Pathological Electrocardiogram. São Paulo: Rocca, 2001. 7ed. Google Scholar
11. Bayes de Luna A et al. Electrocardiología Clínica. Barcelona: Cientifico-Medica, 1977. Google Scholar
12. Gertsch M, Theler A, Foglia E. Electrocardiographic detection of left ventricular hypertrophy in the presence of left anterior fascicular block. American Journal of Cardiology. 1988, Vol. 61, pp. 1098-101. DOI90137-8) | PubMed
13. RP, Grant. Left axis deviation. Circulation. 1956, Vol. 14:233. DOI
14. Sokolow M, Lyon TP. The ventricular complex in left ventricular hypertrophy. American Heart Journal 1949, Vol. 37:161-8. DOI91002-8) | PubMed
15. Gosse P et al. ECG detection of left ventricular hypertrophy: The simpler the better? Journal of Hypertension. 2012, Vol. 30(5):990-96. DOI | PubMed
16. Reicheck N, Devereux RB. Left Ventricular Hypertrophy. Circulation. 1981, Vol. 63(6). DOI | PubMed
17. Peguero JG et al. Electrocardiographic criteria for the diagnosis of left ventricular hypertrophy. J Am Coll Cardiol. 2017, Vol. 69(13), pp. 1964-1703. DOI | PubMed
18. T, Lewis. Observations upon ventricular hypertrophy. Heart. 1914, Vol. 5(1), pp. 367-402. Google Scholar
19. Fragola P V et al. Assessment of left ventricular hypertrophy in patients with essential hypertension. Am J Hypertens. Feb 1993, Vol. 6(2), pp. 164-9. DOI | PubMed
20. Jain A et al. Diagnostic and prognostic utility of electrocardiography for left ventricular hypertrophy. American Heart Journal. 2010, Vol. 159(4), pp. 652-8. DOI | PubMed
21. Gubner R, Ungerleider H. Electrocardiographic criteria of left ventricular hypertrophy. Arch Intern Med. 1943, Vol. 72(2), pp. 196-209. Google Scholar
22. Casale PN et al. Electrocardiographic detection of left ventricular hypertrophy. J Am Coll Cardiol. 1985, Vol. 6(3), pp. 572-80. DOI80118-X) | PubMed
23. Pastore CA, Pinho JA, Pinho C, Samesima N, et al. III Brazilian Society of Cardiology Guidelines on Analysis and Issuance of Electrocardiographic Reports. Arquivos Brasileiros de Cardiologia. April 2016, Vol. 106(4). DOI | PubMed
24. Borys Surawicz, Timothy K. Knilans. Chou's electrocardiography in clinical practice. Philadelphia: Elsevier/Saunders, 2008 6ed. Google Scholar
25. CABRERA E, MONROY JR. Systolic and diastolic loading of the heart. II. Electrocardiographic data. American Heart Journal. May 1952, Vol. 43(5):669-86. DOI90200-0) | PubMed
26. Kelin RC, Vera Z, D Maria AN, et al. Electrocardiographic diagnosis of left ventricular hypertrophy in the presence of left bundle branch block. American Heart Journal. 1984, Vol. 108:502. DOI90422-9) | PubMed
27. Pepberger HV, Goldman MJ, Littman D, et al. Correlation of the orthogonal electrocardiogram and vectorcardiogram. Circulation. 1965, Vol. 35: 746. Google Scholar
28. Flower NO, Wescott RN, Scott RC. The Q wave in precordial electrocardiogram overlying the hypertrophied right ventricle. Circulation. 1952, Vol. 5:441. Google Scholar
29. Flowers NO, Helm RA. The Spatial QRS loop in right ventricular hypertrophy. Circulation. 1953, Vol. 7:573. Google Scholar
30. Myers GB, Klein HA, Stofer BE. The electrocardiographic diagnosis of right ventricular hypertrophy. American Heart Journal. 1948, Vol. 35:1. DOI90186-4)
31. Flowers NC, Horan, LG. Hypertrophy and infarction. Google Scholar
32. Sokolow M, Lyon TP. The ventricular complex in right ventricular hypertrophy. American Heart Journal. 1949, Vol. 38:273. DOI91020-X)
33. Nikus K, Pérez-Riera A R, Konttila K, Barbosa-Barros R. Electrocardiographic recognition of right ventricular hypertrophy. Journal of Electrocardiology. 2018, Vol. 51(1): 46-9. DOI | PubMed
40. Diego Conde, Adrián Baranchuk. Interatrial block as anatomic-electrical substrate of supraventricular arrhythmias: Bayés syndrome. Arch Cardiol Mex. 2014, Vol. 84(1):32-40. DOI | PubMed
---
CORONARY SYNDROME ON THE ECG
1. M, Smith F. The ligation of coronary arteries with electrocardiographic study. Archives of Internal Medicine. 1918, Vol. 22, pp. 8-27. Google Scholar
2. Samson WE, Scher AM. Mechanism of ST segment alteration. Circ Res. 1960, Vol. 8, p. 780. DOI | PubMed
3. Downar E, Janse MJ, Durrer D. The effect of acute coronary artery occlusion on subepicardial transmembrane potentials. Circulation. 1977, Vol. 56, p. 217. DOI | PubMed
4. Kataoka H et al. ST elevation in the chest leads in anterior wall acute myocardial infarction. Am J Cardiol. 1990, Vol. 66, p. 1146. DOI91076-I) | PubMed
5. Sodi-Pallares D et al. Acerca del tejido electricamente muerto. Principia Cardiológica. 1957. Google Scholar
6. Sodi-Palares D. Diagnóstico electrocardiográfico del infarto miocárdico. Principia Cardiológica. 1954. Google Scholar
7. Johnston FD, Hill IGW, Wilson FM. The form of the electrocardiogram in experimental myocardial infarction II. Am Heart J. 1935, Vol. 10, p. 889. DOI90565-8)
8. Parkinson J, Bedford DE. Successive changes in the electrocardiogram after cardiac infarction. Heart 1928;14:195-239. Google Scholar
9. Nable JV, Brady W. The evolution of electrocardiographic changes in ST segment elevation myocardial infarction. Am J Emerg Med. 2009, Vol. 27(6), pp. 734-46. DOI | PubMed
10. B, Surawicz. Electrophysiologic Basis of ECG and Cardiac Arrhythmias. Baltimore: Williams & Wilkins, 1995. Google Scholar
11. Mills RM Jr, et al. Natural history of S-T segment elevation after acute myocardial infarction. American Journal of Cardiology. May 1975, Vol. 35(5), pp. 609-14. DOI90163-1) | PubMed
12. Roubin GS, Shen WF, Nicholson M, et al. Anterolateral ST segment depression in acute inferior myocardial infarction. Am Heart J. 1984, Vol. 107, p. 1177. DOI90297-9) | PubMed
13. Pichler M, Shah PJ, Peter T, et al. Wall motion abnormalities and electrocardiographic changes in acute transmural myocardial infarction. Am Heart J. 1983, Vol. 106, p. 1003. DOI90030-3) | PubMed
14. Boden WE, Spodick DH. Diagnostic significance of precordial ST segment depression. Am J Cardiol. 1989, Vol. 63, p. 358. DOI90332-7) | PubMed
15. Cannon CP, MacCabe C, Stone PH, et al. The electrocardiogram predicts one year outcome of patients with unstable angina and non Q wave myocardial infarction. J Am Coll Cardiol. 1997, Vol. 30, pp. 133-140. DOI00112-9) | PubMed
16. Rohmhilt DW et al. A critical appraisal of the electrocardiographic criteria for the diagnosis of left ventricular hypertrophy. Circulation. 1969, Vol. 40, pp. 185-195. DOI | PubMed
17. Wasserman K, et al. Principles of exercise testing and interpretation. Lea & Febiger, 1994. Google Scholar
18. Bailey RH, LaDue JS, York DJ. Electrocardiographic changes produced by temporary occlusion of a coronary artery. American Heart Journal. 1943, Vol. 25, pp. 164-169. DOI90703-1)
19. Wood FC, Wolferth CC. Angina pectoris: the clinical and electrocardiographic phenomena of the attack. Archives of Internal Medicine. 1931, Vol. 47, pp. 339-65. DOI
20. Lengyel L et al. Initial ECG changes in experimental occlusion of the coronary arteries. American Heart Journal. 1957, Vol. 53, p. 334. Google Scholar
21. Bayes de Luna A et al. Negative T wave in ischemic heart disease: A consensus article. Ann Noninvasive Electrocardiol. 2014, Vol. 19(5), pp. 426-41. DOI | PubMed
22. HEB, Pardee. An electrocardiographic sign of coronary artery obstruction. Archives of Internal Medicine. 1920, Vol. 26, pp. 244-57. DOI
23. III Brazilian Society of Cardiology Guidelines on Analysis and Issuance of Electrocardiographic Reports. Pastore CA et al. 2016, Arquivos Brasileiros de Cardiologia, Vol. 106. DOI | PubMed
24. Wilson FA, Hill IG, Johnston FD. The form of the electrocardiogram in experimental myocardial infarction. III. 1935, American Heart Journal, Vol. 10, p. 903. Google Scholar
25. Wilson FN, Johnston FD, Hill IG. The form of the electrocardiogram in experimental myocardial infarction. IV. 1935, American Heart Journal, Vol. 10, p. 1025. Google Scholar
26. Yochai Birnbaum, Samuel Sclarovsky. The Grades of Ischemia on the Presenting Electrocardiogram. Journal of Electrocardiology. 2001, Vol. 34, pp. 17-25. DOI | PubMed
27. Carley SD et al. What's the point of ST elevation? Emerg Med J. 2002, Vol. 19(2). DOI | PubMed
28. Armin Arbab-Zadeh et al. Contemporary Reviews in Cardiovascular Medicine — Acute Coronary Events. Circulation. 2012, Vol. 125, pp. 1147-1156. DOI | PubMed
29. V Brazilian Society of Cardiology Guidelines on the treatment of acute myocardial infarction with ST-segment elevation. Arq Bras Cardiol. 2015, Vol. 105(2), Supplement 1. Google Scholar
30. Borja Ibanez, Stefan James, Stefan Agewall et al. 2017 ESC Guidelines for the management of acute myocardial infarction in patients presenting with ST-segment elevation. European Heart Journal. 2018, Vol. 39(2), pp. 119-77. DOI | PubMed
31. Jean-Philippe Collet, Holger Thiele, Emanuele Barbato et al. 2020 ESC Guidelines for the management of acute coronary syndromes in patients presenting without persistent ST-segment elevation. European Heart Journal. 2021, Vol. 42, pp. 1289-1367. DOI | PubMed
32. Antoine Ayer, Christian Juhl Terkelsen. Difficult ECGs in STEMI. Journal of Electrocardiology. 2014, Vol. 47, 4, pp. 448-58. DOI | PubMed
33. Samson WE, Scher AM. Mechanism of S-T segment alteration during acute myocardial injury. Circulation Research. 1960, Vol. 8, pp. 780-7. DOI | PubMed
34. Klabunde RE. Cardiac electrophysiology: normal and ischemic ionic currents and the ECG. Adv Physiol Educ. 2017, Vol. 41(1), pp. 29-37. DOI | PubMed
35. Di Diego JM, Antzelevitch C. Acute Myocardial Ischemia: Cellular Mechanisms Underlying ST Segment Elevation. Journal of Electrocardiology. 2014, Vol. 47(4), pp. 486-490. DOI | PubMed
36. Cabrera E et al. Infarct block. Cardiología — Homenaje al Dr. Demetrio Sodi-Pallares. Mexico: Interamericana, 1961. Google Scholar
37. First SR, Bayley RH, Bedford DR. Peri-infarction block. Circulation. 1950, Vol. 2, pp. 31-36. DOI | PubMed
38. Wilson FN, Herman GR. Bundle branch block and arborization block. Arch Int Med. 1920, Vol. 26, pp. 153-60. Google Scholar
39. Carlos Alberto Pastore et al. Applicability of the Electro-Vectorcardiogram in Current Clinical Practice. Arquivos Brasileiros de Cardiologia. 2019, Vol. 113(1), pp. 87-99. DOI | PubMed
72. Samesima N, God EG, Kruse JCL, et al. Brazilian Society of Cardiology Guidelines on the Analysis and Issuance of Electrocardiographic Reports – 2022. Arq Bras Cardiol. 2022, Vol. 119(4), pp. 638-680. DOI | PubMed
---
BUNDLE BRANCH BLOCKS ON THE ECG
1. Eppinger H, Rothberger J. Zur Analyse des Electrokardiograms. Wein klin. Wchnschr. 1909, Vol. 22, pp. 1091-. Google Scholar
2. Scott RC. Left bundle branch block — A clinical assessment. American Heart Journal. October 1965, pp. 535-66. DOI90182-4) | PubMed
3. Lewis T, Rothschild M. The spread of excitatory process in vertebrate hearts. Phil Tr Royal Society London. 1916. Google Scholar
4. Wilson FN, MacLeod G, Barker PS. The order of ventricular excitation in bundle branch block. American Heart Journal. 1932, Vol. 7, p. 305. DOI90500-X)
5. Rosenbaum MB, Elizari MV, Lazzari JO. Los hemibloqueos. Buenos Aires: Paidos, 1968. Google Scholar
6. Scherlag BJ et al. Catheter Technique for Recording His Bundle Activity in Man. Circulation. 1969, Vol. 39, pp. 13-18. DOI | PubMed
7. Baydar ID, Walsh TJ, Massie EA. A vectorcardiographic study of right bundle branch block. Am J Cardiol. 1965, Vol. 15, p. 185. DOI90153-0) | PubMed
8. Brawnwald E, Donoso E, Sapin SO, Grishman A. Right bundle branch block. Circulation. 1956, Vol. 13, p. 866. DOI | PubMed
9. Milnor WR. The electrocardiogram and vectorcardiogram in right ventricular hypertrophy and right bundle branch block. Circulation. 1957, Vol. 16, p. 348. DOI | PubMed
10. Penaloz D, Gamboa R Sime E. Experimental right bundle branch block in the normal human heart. Am J Cardiol. 1961, Vol. 8, p. 767. DOI90202-5) | PubMed
11. Pileggi F et al. Experimental vectorcardiographic study of right bundle branch block. Am J Cardiol. 1966, Vol. 18, p. 698. DOI90217-X) | PubMed
12. Pastore CA, Pinho JA, et al. III Brazilian Society of Cardiology Guidelines on Analysis and Issuance of Electrocardiographic Reports. Arquivos Brasileiros de Cardiologia. 2016, Vol. 106(4). DOI | PubMed
13. Borys Surawicz et al. AHA/ACCF/HRS Recommendations Part III: Intraventricular Conduction Disturbances. Circulation. 2009, Vol. 119, pp. e235-e240. DOI | PubMed
18. Widimsky P et al. Primary angioplasty in acute myocardial infarction with right bundle branch block. Eur Heart J. 2012, Vol. 33(1), pp. 86-95. DOI | PubMed
23. Sgarbossa EB et al. Electrocardiographic diagnosis of evolving acute myocardial infarction in the presence of left bundle branch block. N Engl J Med. 1996, Vol. 334, pp. 481-487. DOI | PubMed
24. Stephen W Smith, Kenneth W Dodd, Timothy D Henry, et al. Diagnosis of ST-Elevation Myocardial Infarction in the Presence of Left Bundle Branch Block With the ST-Elevation to S-Wave Ratio in a Modified Sgarbossa Rule. Ann Emerg Med. 2012, Vol. 60, pp. 766-776. DOI | PubMed
25. Andrea Di Marco, Marcos Rodriguez, Juan Cinca, Antoni Bayes-Genis et al. New Electrocardiographic Algorithm for the Diagnosis of Acute Myocardial Infarction in Patients With Left Bundle Branch Block. Journal of the American Heart Association. 2020. DOI | PubMed
26. Kristian Thygesen, Joseph S. Alpert, Allan S. Jaffe et al. Fourth universal definition of myocardial infarction. European Heart Journal. 2019, Vol. 40, pp. 237-269. DOI | PubMed
---
ATRIOVENTRICULAR BLOCKS ON THE ECG
1. Josephson ME. Josephson's clinical cardiac electrophysiology. Philadelphia: Wolters Kluwer, 2016. Google Scholar
2. El-Sherif N, Scherlag BJ, Lazzara R. An appraisal of second degree and paroxysmal atrioventricular block. Eur J Cardiol. 1976, Vol. 4, pp. 117-30. PubMed
3. Definition of terms related to cardiac rhythm. Am Heart J. 1978, Vol. 95, pp. 796-806. DOI90293-3) | PubMed
4. Surawicz B, Uhley H, Borun R, et al. The quest for optimal electrocardiography. Am J Cardiol. 1978, Vol. 41, pp. 130-45. DOI90153-1) | PubMed
5. Pastore CA, Pinho JA, et al. III Brazilian Society of Cardiology Guidelines on Analysis and Issuance of Electrocardiographic Reports. Arq Bras Cardiol. 2016, Vol. 106, Suppl I, pp. 1-23. DOI | PubMed
8. Barold SS, Hyes DL. Second degree atrioventricular block: a reappraisal. Mayo Clin Proc. 2001, Vol. 76, pp. 44-57. DOI | PubMed
9. Mobitz W. Uber die unvollstandige storung der erregungsuberleitung. Z.Ges.Exp Med. 1924, Vol. 41, pp. 180-237. Google Scholar
11. Hay J. Bradycardia and cardiac arrhythmia produced by depression of certain functions of the heart. Lancet. 1906, Vol. 1, pp. 139-143. DOI20510-3)
21. Barold SS, Herweg B. Second-degree atrioventricular block revisited. Herzschr Elektrophys. 2012, Vol. 23, pp. 296–304. DOI | PubMed
39. Michael Glikson, Jens Cosedis Nielsen, Mads Brix Kronborg, et al. 2021 ESC Guidelines on cardiac pacing and cardiac resynchronization therapy. European Heart Journal. 2021, Vol. 42, pp. 3427-520. DOI | PubMed
44. Ricardo Alkmim Teixeira, Alexsandro Alves Fagundes, José Mário Baggio Junior et al. Brazilian Guidelines for Cardiac Implantable Electronic Devices – 2023. Arq Bras Cardiol. 2023, Vol. 120(1):e20220892. DOI | PubMed
49. Fred M. Kusumoto, Mark H. Schoenfeld, Coletta Barrett et al. 2018 ACC/AHA/HRS Guideline on the Evaluation and Management of Patients With Bradycardia and Cardiac Conduction Delay: Executive Summary. Circulation. 2019;140:e333–e381. DOI | PubMed
---
TACHYARRHYTHMIAS
1. Yang XS, Beck GJ, Wilkoff BL. Redefining normal sinus heart rate. J Am Coll Cardiol. 1995, Vol. 25(2), p. 193. DOI92974-T)
2. Palatini P. Need for a revision of the normal limits of resting heart rate. Hypertension. 1999, Vol. 33(2), pp. 622-5. DOI | PubMed
3. Mason JW et al. Electrocardiographic reference ranges derived from 79,743 ambulatory subjects. J Electrocardiol. 2007, Vol. 40(3), pp. 228-34. DOI | PubMed
4. Wellens HJ. Electrophysiology: ventricular tachycardia: diagnosis of broad QRS complex tachycardia. Heart. 2001, Vol. 86(5), pp. 579-85. DOI | PubMed
5. Wellens HJ, Bär FW, Lie KI. The value of the electrocardiogram in the differential diagnosis of a tachycardia with a widened QRS complex. Am J Med. 1978, Vol. 64(1), pp. 27-33. DOI90176-6) | PubMed
6. Robert W. Neumar et al. Part 8: Adult Advanced Cardiovascular Life Support. Circulation. 2010, Vol. 122(18), pp. S729-S767. DOI | PubMed
7. Katja Zeppenfeld, Jacob Tfelt-Hansen, Marta de Riva et al. 2022 ESC Guidelines for the management of patients with ventricular arrhythmias and the prevention of sudden cardiac death. European Heart Journal. 2022, Vol. 43(40), pp. 3997-4126. DOI | PubMed
10. Josephson ME et al. Mechanisms of ventricular tachycardia. Circulation. 1987, Vol. 75, pp. III41–III47. DOI | PubMed
11. Wellens HJ, Bar FW, Lie KI. The value of the electrocardiogram in the differential diagnosis of a tachycardia with a widened QRS complex. Am J Med. 1978, Vol. 64, pp. 27-33. DOI90176-6) | PubMed
12. Kindwall KE, Brown J, Josephson ME. Electrocardiographic criteria for ventricular tachycardia in wide complex left bundle branch block morphology tachycardias. Am J Cardiol. 1988, Vol. 61, pp. 1279-83. DOI91169-1) | PubMed
175. Alzand BSN, Crijns HJGM. Diagnostic criteria of broad QRS complex tachycardia: decades of evolution. Europace. 2011, Vol. 13, pp. 465-72. DOI | PubMed
176. Pedro Brugada, Josep Brugada, Lluis Mont, Joep Smeets, Erik W Andries. A new approach to the differential Diagnosis of a regular tachycardia with a wide QRS complex. Circulation. 1991, Vol. 83, pp. 1649-59. DOI | PubMed
177. Alfred Pick, Richard Langendorf. Differentiation of supraventricular and ventricular tachycardias. Progress in Cardiovascular Diseases. March 1960, Vol. 2(5), pp. 391-407. DOI80009-3)
180. Hein JJ Wellens, Fritz WHM Bar, KI Lie. The Value of the Electrocardiogram in the Differential Diagnosis of a Tachycardia with a Widened QRS Complex. American Journal of Medicine. 1978, Vol. 64, pp. 27-33. DOI90176-6) | PubMed
181. Marek Jastrzebski et al. Comparison of five electrocardiographic methods for differentiation of wide QRS-complex tachycardias. Europace. 2012, Vol. 14, pp. 1165-71. DOI | PubMed
191. Federico Moccetti et al. Simplified Integrated Clinical and Electrocardiographic Algorithm for Differentiation of Wide QRS Complex Tachycardia — The Basel Algorithm. J Am Coll Cardiol EP. 2022, Vol. 8, pp. 831-39. DOI | PubMed
192. Luis Fernando Pava et al. R-wave peak time at DII: A new criterion for differentiating between wide complex QRS tachycardias. Heart Rhythm 2010;7:922–926. DOI | PubMed
193. András Vereckei et al. New algorithm using only lead aVR for differential diagnosis of wide QRS complex tachycardia. Heart Rhythm. 2008, Vol. 5, pp. 89-98. DOI | PubMed
---
PACEMAKER ON THE ECG
1. Schoenfeld MH. Pacemaker programmers: an updated synopsis. Card Electrophysiol Rev. 1999, Vol. 3, pp. 20-3. DOI
2. Jongnarangsin K, Thaker JP, Thakur RK. Pacemakers and magnets: an arranged marriage. Heart Rhythm 2009;6:1437–8. DOI | PubMed
3. Richard G Trohman, Michael H Kim, Sergio L Pinski. Cardiac pacing: the state of the art. Lancet. 2004, Vol. 364, pp. 1701-19. DOI17358-3) | PubMed
4. G. Mond, Harry. Interpreting the Normal Pacemaker Electrocardiograph. Heart Lung and Circulation. 2018. DOI | PubMed
5. Emanuela T. Locati et al. Role of Surface Electrocardiograms in Patients with Cardiac Implantable Electronic Devices. Card Electrophysiol Clin. 2018, Vol. 10, pp. 233-55. DOI | PubMed
6. Alan D. Bernstein et al. The Revised NASPE/BPEG Generic Code for Antibradycardia, Adaptive-Rate, and Multisite Pacing. PACE. 2002, Vol. 25(2), pp. 260-3. DOI | PubMed
18. Xiayan Shen et al. Electrocardiography findings in right ventricular apical pacing. Singapore Med J. 2020, Vol. 61(10), pp. 517-22. DOI | PubMed
20. Keping Chen et al. Comparison of electrocardiogram characteristics and pacing parameters between left bundle branch pacing and right ventricular pacing. Europace. 2019, Vol. 21, pp. 673-80. DOI | PubMed
26. Alexander Romeno Janner Dal Forno et al. Left Bundle Branch Pacing of the His-Purkinje System: Initial Experience. Arq Bras Cardiol. 2021. DOI | PubMed
27. Nadine Ali et al. His Bundle Pacing: A New Frontier in the Treatment of Heart Failure. Arrhythmia & Electrophysiology Review. 2018, Vol. 7(2), pp. 103-10. DOI | PubMed
28. Karol Curila et al. Both selective and nonselective His bundle, but not myocardial, pacing preserve ventricular electrical synchrony. Heart Rhythm. 2020, Vol. 17, pp. 607-14. DOI | PubMed
29. Rafael Barba-Pichardo et al. Permanent His-bundle pacing: seeking physiological ventricular pacing. Europace. 2010, Vol. 12, pp. 527-533. DOI | PubMed
31. Asit Das, Suman Chatterjee Das. Left bundle branch area pacing: Electrocardiographic features. Journal of Arrhythmia. 2021, Vol. 37, pp. 1139-47. DOI | PubMed