Normal ECG: Complete Guide to Criteria and Reference Values
Recognizing a normal electrocardiogram is the fundamental basis for any healthcare professional interpreting ECGs. Before identifying abnormalities, mastering normalcy criteria is essential. This complete guide presents all parameters necessary to confirm an ECG within normal limits.
What Defines a Normal ECG?
An ECG is considered normal when it meets a set of criteria related to rhythm, rate, intervals, electrical axis, and wave morphology. The absence of any significant alterations in these parameters characterizes normalcy.
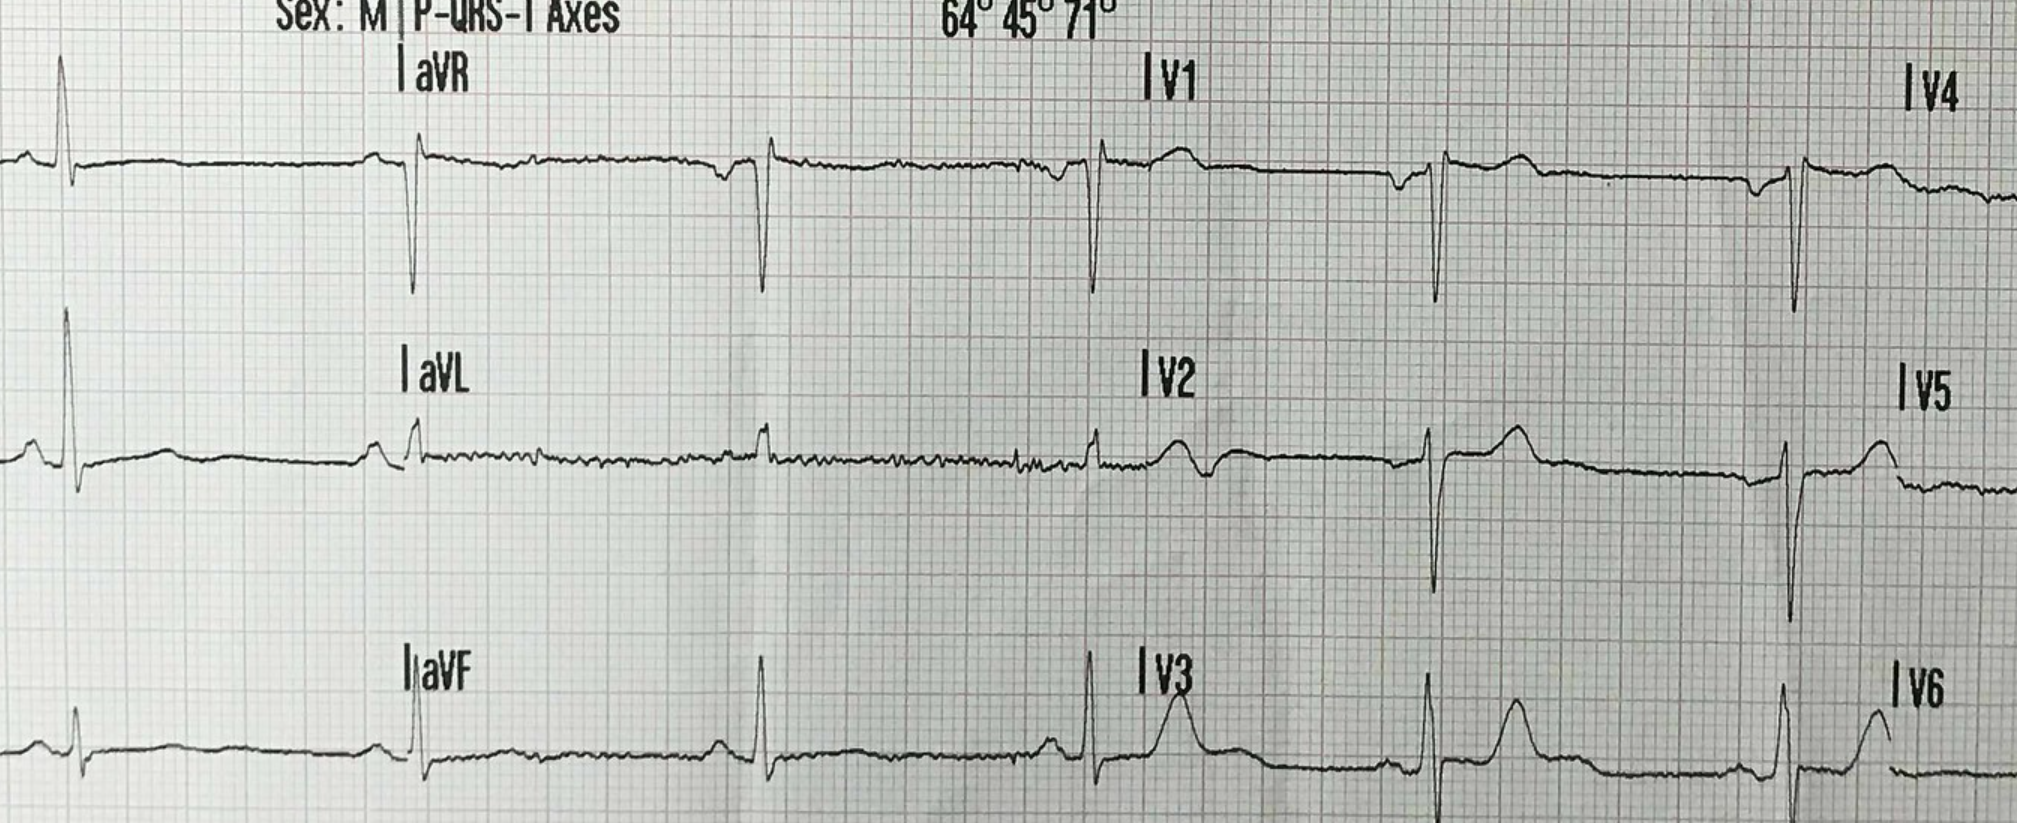
!Normal ECG
1. Sinus Rhythm: The Fundamental Criterion
Sinus rhythm is the first characteristic of a normal ECG. To confirm sinus rhythm, verify:
Sinus Rhythm Criteria
| Criterion | Characteristic |
|-----------|----------------|
| P wave present | Before each QRS |
| P wave positive | In leads I, II, and aVF |
| P wave negative | In aVR |
| PR interval | Constant (0.12-0.20s) |
| Regular RR | Variation < 10% |
The sinus P wave has a rounded morphology and duration less than 120 ms.
2. Normal Heart Rate
Normal heart rate at rest is between:
- Adults: 60-100 bpm
- Children: Varies with age (higher)
- Athletes: May be 40-60 bpm (physiological sinus bradycardia)
How to Calculate HR on ECG
- 300 Method: 300 ÷ number of large squares between RR
- 1500 Method: 1500 ÷ number of small squares between RR
- Irregular rhythm: Count QRS in 6 seconds × 10
3. Normal Intervals and Segments
PR Interval
| Parameter | Normal Value |
|-----------|--------------|
| Duration | 0.12 - 0.20 seconds |
| Small squares | 3 - 5 |
The PR interval represents atrioventricular conduction time.
QRS Complex
| Parameter | Normal Value |
|-----------|--------------|
| Duration | < 0.12 seconds |
| Small squares | < 3 |
Narrow QRS indicates normal intraventricular conduction.
QT Interval and QTc
| Parameter | Men | Women |
|-----------|-----|-------|
| Normal QTc | < 450 ms | < 460 ms |
| Borderline QTc | 450-469 ms | 460-479 ms |
| Prolonged QTc | ≥ 470 ms | ≥ 480 ms |
> Important: Use our QTc Calculator to precisely measure corrected QT from ECG photos.
ST Segment
Normal ST segment:
- Is isoelectric (at the same level as baseline)
- Acceptable variation: ±1 mm
- Smooth transition to T wave
4. Normal Electrical Axis
The normal cardiac electrical axis is between:
| Range | Degrees |
|-------|---------|
| Normal | -30° to +90° |
| Left deviation | < -30° |
| Right deviation | > +90° |
Quick Method to Evaluate Axis
1. Lead I positive + aVF positive = Normal axis (0° to +90°)
2. Lead I positive + aVF negative = Possible left deviation
3. Lead I negative + aVF positive = Right deviation
5. Normal Wave Morphology
P Wave
- Amplitude: < 2.5 mm (0.25 mV)
- Duration: < 120 ms (3 small squares)
- Morphology: Rounded, monophasic in lead II
QRS Complex
- Q wave: < 40 ms duration, < 25% of R wave amplitude
- R wave: Normal progression from V1 to V6
- S wave: Decreases from V1 to V6
T Wave
- Polarity: Generally same as QRS
- Positive: I, II, V3-V6
- Negative: aVR
- Variable: III, aVL, aVF, V1-V2
6. Normal ECG Checklist
Use this checklist to confirm normalcy:
- [ ] Sinus rhythm (P before each QRS, P positive in II)
- [ ] HR between 60-100 bpm
- [ ] PR interval 0.12-0.20s
- [ ] QRS < 0.12s
- [ ] QTc normal for sex
- [ ] Axis between -30° and +90°
- [ ] Isoelectric ST
- [ ] T waves concordant with QRS
- [ ] No pathological Q waves
7. Normal ECG Report Example
> Report: Sinus rhythm, heart rate 72 bpm. Normal electrical axis. PR, QRS, and QTc intervals within normal limits. Isoelectric ST segment. T waves of normal morphology and polarity. Conclusion: Electrocardiogram within normal limits.
8. Normal Variants
Some alterations may be considered normal variants:
- Sinus bradycardia in athletes
- Respiratory sinus arrhythmia in young people
- Benign early repolarization
- Juvenile T wave pattern (negative T in V1-V3 in young people)
9. When to Suspect Abnormality
Warning signs requiring investigation:
- PR > 200 ms (AV block)
- QRS > 120 ms (bundle branch block)
- Prolonged QTc (arrhythmia risk)
- Significant axis deviation
- ST depression or elevation
- Pathological Q waves
Conclusion
Mastering normal ECG criteria is essential for clinical practice. With this guide, you have a complete reference of normal values and characteristics that define a normal electrocardiogram.
To measure the QT interval accurately, use our QTc Calculator - a free tool with artificial intelligence that automatically analyzes ECG photos.
References:
- Surawicz B, Knilans TK. Chou's Electrocardiography in Clinical Practice. 6th ed.
- Goldberger AL, et al. Goldberger's Clinical Electrocardiography. 9th ed.
- Kraemer A. A Arte da Eletrocardiografia. 2024.
Learn more on Kraemer Academy